Plotting Data on MPAS Native Grid
This notebook shows how to plot MPAS native grids
© Software was developed by Charles Doutriaux. (April 2018)
Table Of Contents
Necessary Modules
In [1]:
from __future__ import print_function
import e3sm_nex
import cdms2
import vcs
import requests
import numpy
Download Data
In [2]:
def download(fnm):
    r = requests.get("https://cdat.llnl.gov/cdat/sample_data/%s" % fnm,stream=True)
    with open(fnm,"wb") as f:
        for chunk in r.iter_content(chunk_size=1024):
            if chunk:  # filter local_filename keep-alive new chunks
                f.write(chunk)

for filename in ["ocean.oEC60to30v3.scrip.161222.nc", "mpas_sample.nc"]:
    download(filename)


data_path = "mpas_sample.nc"
grid_file_path = "ocean.oEC60to30v3.scrip.161222.nc"
Grid Info
In [3]:
# Reads in data from grid file
gf = cdms2.open(grid_file_path)

# needs to send filled data
lats = gf("grid_center_lat").filled()
lons = gf("grid_center_lon").filled()

lat_corners = gf("grid_corner_lat").filled()
lon_corners = gf("grid_corner_lon").filled()
Generate MPAS Grid
In [4]:
# Generate grid
grid = e3sm_nex.generateMPASGrid(lats, lons, lat_corners, lon_corners)
Load Data and Apply Grid
In [5]:
# Load data and apply grid
fd = cdms2.open(data_path)
data = fd("timeMonthly_avg_activeTracers_temperature")
# Need to clean up missing/bad values
data = cdms2.MV2.masked_greater(numpy.abs(data),1.e20)
data = e3sm_nex.applyGrid(data,grid)
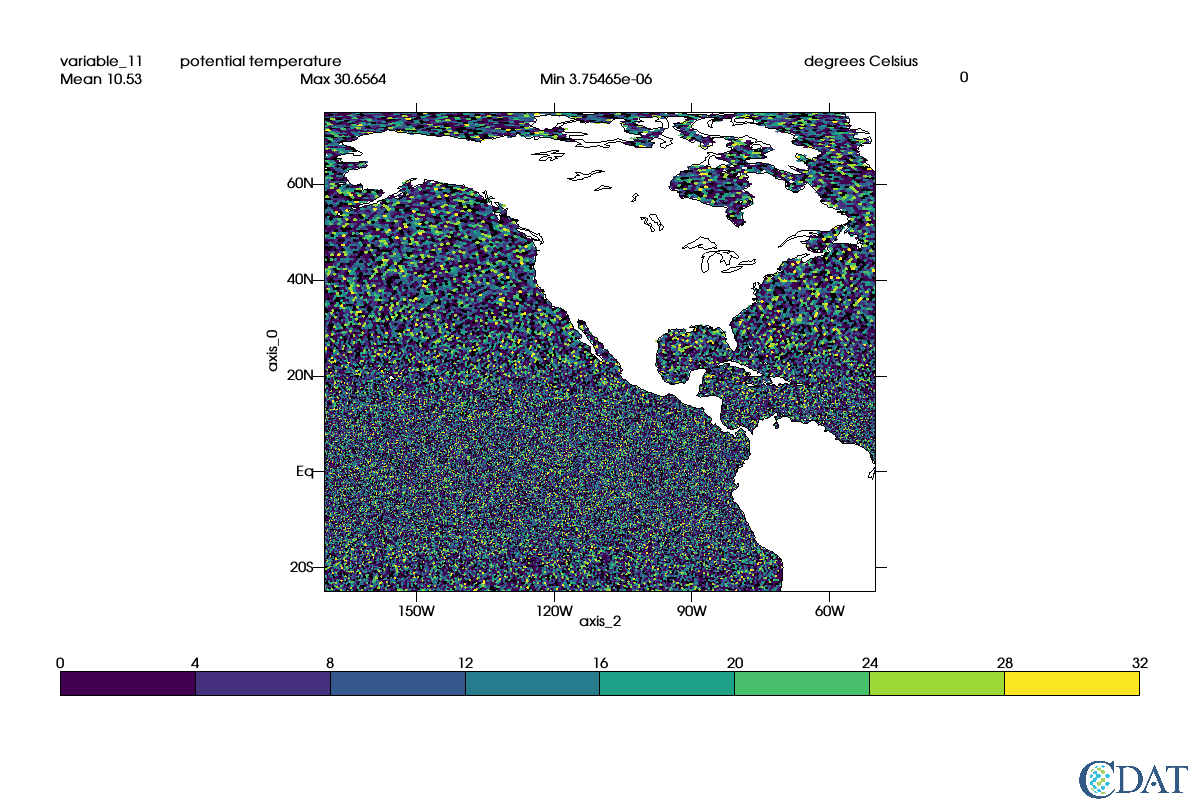
Plot
In [6]:
# plot
# create Canvas
x=vcs.init(bg=True, geometry=(1200,800))

# Create graphics method
mesh = vcs.createmeshfill()

# Only show a sub domain
mesh.datawc_x1 = -170
mesh.datawc_x2 = -50
mesh.datawc_y1 = -25
mesh.datawc_y2 = 75

# If you want to show mesh
# mesh.mesh = True

x.plot(data, mesh, ratio="autot")
/home/doutriaux1/anaconda2/envs/cdat_test/lib/python2.7/site-packages/vtk/util/numpy_support.py:135: FutureWarning: Conversion of the second argument of issubdtype from `complex` to `np.complexfloating` is deprecated. In future, it will be treated as `np.complex128 == np.dtype(complex).type`.
  assert not numpy.issubdtype(z.dtype, complex), \
Out[6]: